Visualizing Cells and Humans in 3D
By Terry S. Yoo, Donald Bliss, Bradley C. Lowekamp, and David T. Chen (US National Library of Medicine); Gavin E. Murphy (Indiana University Bloomington); Kedar Narayan, Lisa M. Hartnell, Thao Do, and Sriram Subramaniam (US National Cancer Institute)
NOTE: This is an overview of the entire article, which appeared in the September/October 2012 issue of the IEEE Computer Graphics and Applications magazine.
Click here to read the entire article.
The authors of this paper draw a comparison between two case studies in biological imaging which seem far different in scope and technique. The two studies used quite different techniques, and the ratio of the physical sizes of the biological samples are on the order of 105. But they rely on methods of analysis and modelling that are remarkably similar.
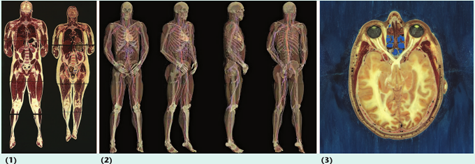
In Study 1 – the Visible Human Project (VHP), performed more than 15 years ago – researchers froze two human cadavers and exposed successive body cross-sections by milling the frozen blocks in millimeter increments. The exposed cross-sections were photographed with a film camera.

Figure 1. VHP renderings. (1) Coronal views. (2) Volume renderings. (3) An axial-image close-up of the head. The VHP collected whole-body data of two human subjects, male and female, at millimeter resolutions using a custom cryomacrotome. The resulting datasets remain some of the most comprehensive studies of human anatomy today.
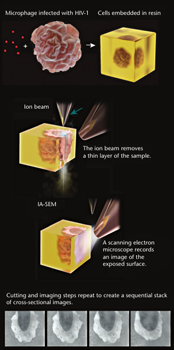
In Case 2, which was performed recently by the authors of this paper, cell samples were embedded in epoxy resin blocks. Successive cross-sections of the cells were exposed by milling the blocks with focused ion beams. The exposed cross-sections were imaged using a scanning electron microscope.

Figure 2. Data capture with ion-abrasion scanning electron microscopy (IA-SEM). We prepare samples using techniques similar to those for transmission electron microscopy, embedding the fixed and dehydrated biological sample in an epoxy resin. An ion beam repeatedly mills or abrades and polishes a flat surface in the sample, exposing layer after layer of structure at a cellular level. A scanning electron microscope acquires images of the exposed faces of the sample block. Each pass of the ion beam can remove layers as thin as 10 nanometers, with pixel dimensions as small as 3 to 6 nm.
The second study is distinguished by work being done in the digital domain to process the extremely large resulting data set, identify and segment objects of interest, and finally present the cellular structures so that viewers can more easily perceive and comprehend them.
As one outcome of this study, the authors report on new insights into the mechanisms by which HIV virons are transferred to macrophages.
A similar study, performed on normal and diseased mitochondria, yielded quantitative results suggesting that the mitochondrial shape could be an early indication of a disease state.
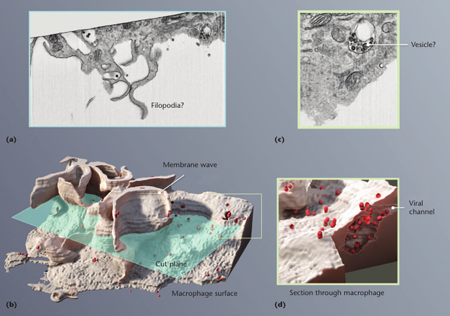
The authors describe a wide range of techniques, including 3D printing, that can provide researchers with insights that would not be apparent from raw data. One example of the resulting dramatic presentation is shown below. It shows a 2D view and a 3D perspective visualization of an HIV-infected macrophage. Whereas in the 2D view, certain structures appear to be filaments (Filopodia ?), in the 3D view they can be seen to be, in fact, membrane walls. The article points out that “Life exists in three dimensions, and understanding the spatial relationships among the features and phenomena requires modeling and analysis beyond 2D space.”

Figure 3. Results from ion-abrasion scanning electron microscopy (IA-SEM) of HIV-infected monocyte-derived macrophages. (a) 2D imaging can lead to the erroneous conclusion that the structures of interest are filopodia (thread-like filaments of membrane). (b) 3D imaging reveals that these structures are membrane waves or walls. (c) 2D imaging suggests that HIV virions are sequestered in vesicles or bubbles in the cell. (d) 3D imaging reveals that the structures are not vesicles but are pockets that have complex tunnels and channels that communicate with the environment outside the cell.
The authors conclude with a view of the challenges and promises of advanced imaging and presentation technologies in the service of biological research.
ABOUT THE AUTHORS
Information about the authors is included in the complete article.


